Launch Services Woes

For the past week or so, I’ve been suffering from slowness in the Finder, corrupted icons and terrible performance in our version control client (Versions).

Today, I decided to do something about it. The first step was to sample Versions while it was beachballing. The app was spending most of its time in [NSWorkspace iconForFile:]. That, along with the corrupted icons I was seeing in various apps made me suspect that there was a corrupted database somewhere. But where?

After a lot of Googling, I finally found this link. The path to lsregister has changed a bit in Mountain Lion, so this is the command I ended up using:

/System/Library/Frameworks/CoreServices.framework/Versions/A/Frameworks/LaunchServices.framework/Versions/A/Support/lsregister -kill -seed -r

My development machine immediately felt like it was running at normal speed (I refuse to say snappy until they update the Mac Pros.) And, of course, as soon as I figured that out, I found that someone smarter had beaten me to it.

So how did this happen? In looking at the documentation for the Launch Services database, there is a lot of information that’s collected when applications are first launched. As developers, we launch applications all fricken’ day. And we also know that pounding on a database is the best way to break it.

So, the next time you’re seeing general slowness on your Mac, don’t forget to give Launch Services a kick in the pants. Guaranteed to be more effective than zapping your PRAM.
Logging with Xcode Breakpoints

If you don’t already know about it, setting actions for breakpoints in Xcode is a great way to monitor repetitive code without adding a bunch of NSLog() to your code.

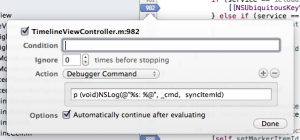
After setting a breakpoint, right-click and select “Edit Breakpoint…”. Then select “Debugger Command” for the Action. You can enter any valid debugger command at this point. When you check “Automatically continue after evaluating”, the debugger will run your command and your code doesn’t stop. Sweet.

This approach works great when you want to log the contents of a variable by entering a command like po myVar. But there’s a problem: I often want to know where this variable is getting logged, so I ended up creating another breakpoint with a script print "myMethod in myClass" (in lldb) or echo myMethod in MyClass\n (in gdb) command.

Great. Now you have to manage two breakpoints instead of one. Worse, when you have code like this:

for (MyClass *class in aCraploadOfClasses) {
    if (class.propertyThatIsRarelySet) {
        [self doSomethingWith:class];
    }
}

You can’t use the two breakpoint trick when you want to track class before it’s sent to -doSomethingWith:.

It’s taken me a way too long to come up with what is now a totally obvious solution: make the debugger command call NSLog!

For example:

Let’s break down the debugger command a bit:

p (void)NSLog(@"%s: %@", _cmd, syncItemId)

The _cmd is a C string with the current method name (it’s passed to every Objective-C method by objc_msgSend). At runtime, _cmd makes a very good replacement for __PRETTY_FUNCTION___. The syncItemId is the thing I was tracking in several different methods of my class. The void return value is needed to keep the p command happy.

This little discovery is going to save me tons of time: no more dropping into Xcode to add a line of code that you’ll end up deleting after tracking down the problem. Hope it helps you, too!